Multiple Choice
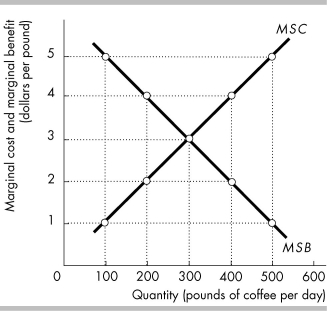
-The above figure shows the marginal social benefit and marginal social cost curves of coffee in the nation of Kaffenia. Which of the following would result in the quantity of coffee in Kaffenia differing from the efficient quantity?
Definitions:
Related Questions
Q92: The price elasticity of demand for new
Q149: Considering all costs of production, the marginal
Q172: Asian women lag far behind the West
Q187: The above figure shows the demand curve
Q190: The above table gives the demand schedule
Q367: If penalties are imposed on both the
Q382: In the above table, what is the
Q396: By reducing its output compared to a
Q431: Nick can purchase each milkshake for $2.
Q506: The income elasticity of demand for vacations