Multiple Choice

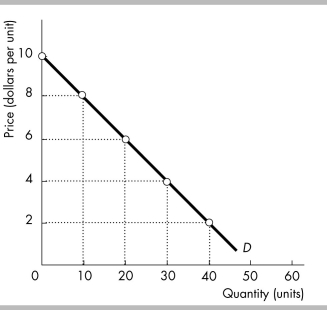
-The figure above illustrates a linear demand curve. In the price range from $8 to $6, demand is ________ and in the price range $4 to $2, demand is ________.
Definitions:
Related Questions
Q82: How are the cross elasticity of demand
Q174: Fred's income has just risen from $940
Q233: The table above gives the demand schedule
Q270: A firm that is the only seller
Q287: Can both producer surplus and consumer surplus
Q302: The figure above shows the market for
Q303: Consumers don't always have to pay the
Q344: If a good is inferior, its income
Q373: A changes in which of the following
Q470: If the cross elasticity of demand between