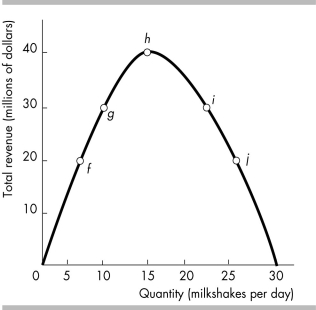
-The figure above represents the behavior of total revenue as price falls along a straight-line demand curve. What is the price elasticity of demand if total revenue is given by point f?
Definitions:
Negative Correlation
A relationship between two variables in which one variable increases as the other decreases, and vice versa.
Opposite Directions
Refers to two or more entities, trends, or forces moving in contrary paths or exhibiting contrary behavior in a given context.
Omitted Variable
An Omitted Variable is a relevant variable that has been left out of a regression model, potentially leading to biased results.
Laboratory Experiments
Controlled testing environments where researchers manipulate variables to observe and measure their effects, often used in scientific and social science research.
Q10: At the beginning of World War II,
Q61: A good with a horizontal demand curve
Q96: If a fall in the price of
Q131: The increase in the demand for widgets,
Q225: Which curve is the same as the
Q252: The table above gives the demand schedule
Q280: Suppose a 10 percent increase in the
Q289: The supply of lettuce in the short
Q308: What is the significance of the concepts
Q386: A necessity (such as food and shelter)