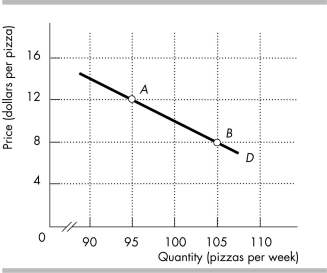
-The figure above shows the demand curve for pizza. Using the midpoint method and moving from point A to point B, calculate the
a) percentage change in price.
b) percentage change in quantity demanded.
c) price elasticity of demand.
Definitions:
Aggregate Supply
Aggregate supply is the total supply of goods and services that firms in an economy are willing and able to produce at a given overall price level in a specific time period.
National Debt
The total amount of money that a country's government has borrowed by issuing securities, typically through bonds.
Fiscal Deficit
The financial shortfall when a government's expenditures exceed its revenue.
International Monetary Fund
An international organization created for the purpose of promoting global monetary and exchange stability, facilitating the expansion and balanced growth of international trade, and assisting in the establishment of a multilateral system of payments for current transactions.
Q130: The table gives the demand and supply
Q178: Goods and services that can be produced
Q213: Taco Bell's economists determine that the price
Q216: Specialty chocolate bars with a high cocoa
Q242: The figure above represents the behavior of
Q352: If the price of oil is $60
Q396: If the price of a movie download
Q439: For many goods, the price elasticity of
Q461: In the above figure, if the two
Q477: A fall in the price of a