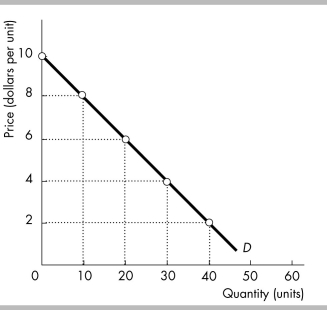
-The figure above illustrates a linear demand curve. In the range from $8 to $6
Definitions:
Full Cost
The total cost of production that includes both direct and indirect costs, such as raw materials, labor, and overhead.
Return On Investment
A performance measure used to evaluate the efficiency or profitability of an investment or compare the efficiency of several different investments.
Total Variable Cost
The cumulative cost that varies directly with the level of production or sales volume.
Cost-Plus Pricing
A selling price determination approach where a fixed markup is added to the per unit cost of the product.
Q47: The figure above shows the market demand
Q55: Fitness is a magazine for women about
Q83: The figure shows the demand curve for
Q88: The marginal cost curve<br>A) shows the maximum
Q101: Which of the following factors will make
Q103: If a 6 percent decrease in the
Q150: As time passes after a change in
Q229: The demand for a good is more
Q440: The "law of demand" is illustrated by
Q523: If the percentage change in quantity demanded