Multiple Choice

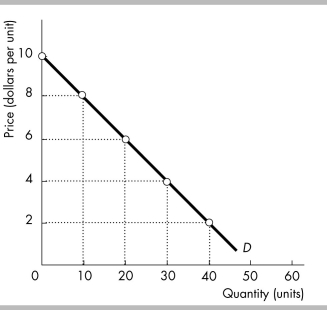
-The figure above illustrates a linear demand curve. If the price falls from $6 to $4
Definitions:
Related Questions
Q96: If the price of a hot dog
Q195: In the market for tablet computers, the
Q202: The above figure shows the marginal social
Q312: If the demand curve for a good
Q377: In the figure above, when the market
Q401: Which of the following conditions could lead
Q419: When the percentage change in quantity demanded
Q498: When the price elasticity of demand for
Q503: A normal good is defined as a
Q526: Total revenue for skis is at a