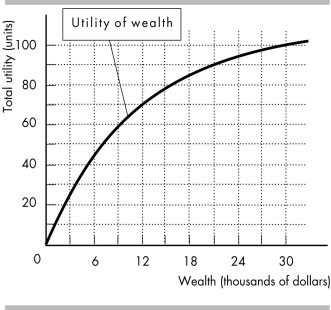
-Ashton has the utility of wealth curve shown in the above figure. He owns a sports car worth $30,000, and that is his only wealth. Ashton is a careless driver and there is a 30 percent chance that he will have an accident within a year. If he does have an accident, his car is worthless. Suppose all sports cars owners are like Ashton. An insurance company agrees to pay each person who has an accident the full value of their car. The company's operating expenses are $1,000. Ashton will ________ the company's policy because the minimum premium for such insurance that the company is willing to accept is ________ the maximum premium Ashton is willing to pay.
Definitions:
Ordinal
Pertaining to a type of data or scale that expresses order or ranking among categories without implying precise measurements.
Friedman Test
A non-parametric statistical test for comparing more than two related groups, assessing differences across multiple test attempts.
Rejection Region
In statistical hypothesis testing, it is the range of values for which the null hypothesis is considered improbable enough to be rejected.
Significance Level
The threshold below which a null hypothesis is rejected in a statistical test, often denoted by alpha (α) and commonly set at 0.05 or 5%.
Q32: John's utility of wealth curve is shown
Q78: The diagram above illustrates the market for
Q174: "People buy insurance do protect themselves from
Q206: According to the diagram in the above
Q268: In general, the more resources that are
Q405: The quantity of CDs that firms plan
Q408: The figure illustrates the market for chairs.
Q456: The above figure shows the market for
Q484: Explain the difference between a change in
Q488: The above figures show the market for