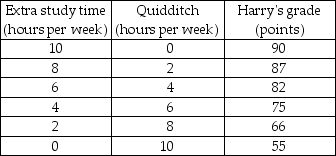
-Harry usually spends 10 hours a week playing Quidditch. However, his Defense Against the Dark Arts exam is coming and he needs more time to study for the exam. If he does not study at all, the lowest grade he will receive is 55. But Harry realizes that this grade is unacceptable and so he has to give up some of his Quidditch time. But how much? He asks his friend Hermione, who is very good at Magical Economics, to help him figure this out. Together, they come up with the schedules of Harry's possibilities and values in the tables above. Then Hermione quickly finds the solution. But Harry still looks puzzled. Help Hermione to explain her solution to Harry.
a) Draw Harry's production possibilities frontier with the Quidditch hours on the horizontal axis and Harry's grade, starting at 55, on the vertical axis.
b) What is the opportunity cost of the first two hours of Quidditch? What is the marginal cost of the 5th hour?
c) What is Harry's opportunity cost of raising his grade from 82 points to 87 points?
d) Draw Harry's marginal cost of playing Quidditch curve. What happens to the marginal cost if Harry spends more time playing Quidditch?
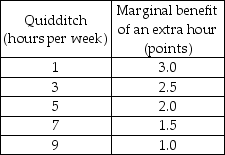
e) Draw Harry's marginal benefit from playing Quidditch curve. Describe the relationship between Harry's time spent playing Quidditch and the marginal benefit from playing Quidditch.
f) For how many extra hours did Hermione recommend Harry to study? Why? If Harry follows her advice, what grade will he expect? What do you think Hermione said when Harry asked why he should not spend more time playing Quidditch?
Definitions:
Mobbing Behavior
Aggressive behavior by a group or individual repeatedly towards another individual, often in a workplace setting.
Best Territories
In behavioral ecology, territories that provide the most resources or strategic advantages, often leading to preferential selection by individuals or groups.
Neoteny
The retention of juvenile features in the adult animal or human.
Juvenile Traits
Physical or behavioral characteristics typically observed in the young of a species.
Q81: If income is equally distributed, the Gini
Q166: The Lorenz curve graphs the<br>A) cumulative percentage
Q168: Refer to the production possibilities frontier in
Q189: The more that Clayton earns, the higher
Q244: A firm's demand for labor curve<br>A) is
Q256: In the figure above, the poorest 20
Q257: Refer to the production possibilities frontier figure
Q308: In the above figure, curve b shows
Q327: Which of the following is NOT an
Q329: The table shows the distribution of human