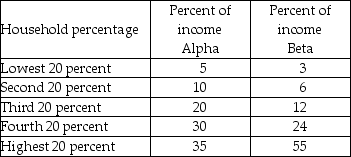
-The above table shows the distribution of income in two imaginary countries, Alpha and Beta.
a) What does the table tell you about the second 20 percent group in each country?
b) Calculate the cumulative percentage for both countries.
c) Interpret the cumulative percentage for the third 20 percent group in both countries.
Definitions:
Q13: The above table shows the distribution of
Q21: The distribution of U.S. income is NOT
Q23: In the United States, the median household
Q116: The labor supply curve has a positive
Q140: The value of marginal product (VMP) of
Q242: Which of the following decreases the supply
Q251: If income is equally distributed, the Gini
Q315: The table above shows the number of
Q334: Air pollution caused by lead<br>A) has never
Q336: The measured distribution of _ is a