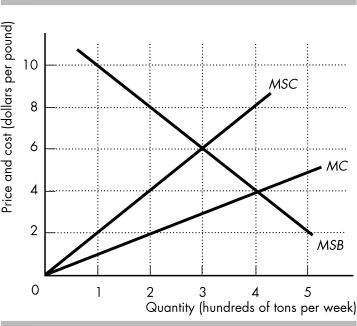
-The above figure shows the marginal private cost curve, marginal social cost curve, and marginal social benefit curve for cod, a common resource. A quota to prevent the overuse of the cod sets the catch equal to
Definitions:
National Pollutant
A substance that contaminates the environment on a national scale, often regulated by government agencies due to its harmful effects.
Discharge Permits
Authorizations issued by environmental regulatory agencies allowing the release of specific pollutants into the environment, under defined conditions.
EPA
The Environmental Protection Agency is a U.S. federal agency tasked with protecting human health and the environment through regulations and enforcement.
Montreal Protocol
An international treaty designed to protect the ozone layer by phasing out the production of numerous substances responsible for ozone depletion.
Q42: In a single payer model of healthcare,
Q61: Which of the following lowers the current
Q72: If the number of ITQs issued equals
Q82: The above table has the marginal product
Q88: The table above gives information about the
Q167: The efficient level of college enrollment in
Q191: The graph shows costs and benefits of
Q229: A private cost is a cost of
Q288: An auction of the leases to drill
Q293: The table above shows the marginal costs