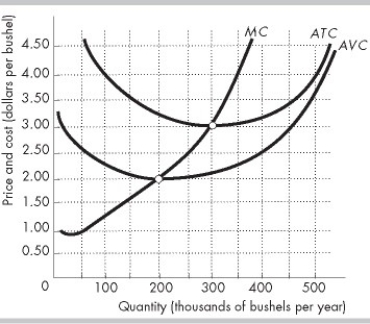
-The figure above shows a typical perfectly competitive corn farm, whose marginal cost curve is MC and average total cost curve is ATC. The market is initially in a long-run equilibrium, where the price is $3.00 per bushel. Then, the market demand for corn decreases and, in the short run, the price falls to $2.50 per bushel. In the new short-run equilibrium, the farm produces ________ bushels of corn and sells corn at ________ per bushel.
Definitions:
Q73: Farmer Brown produces corn in a perfectly
Q104: Which curve intersects the AVC curve at
Q120: A monopoly is a firm that produces
Q136: A worldwide hops (a flower used in
Q147: The demand for a product produced in
Q202: The table above shows the short-run product
Q287: When the total product curve is drawn
Q362: Acme is a perfectly competitive firm. It
Q479: As output increases, AVC approaches ATC because
Q480: The firms in a perfectly competitive are