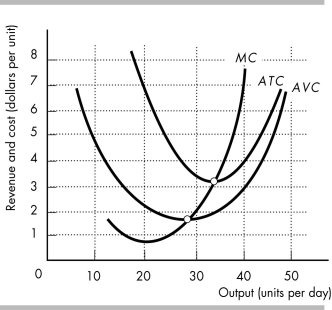
-The above figure shows the cost curves of a profit-maximizing perfectly competitive firm. If the price equals $7
a) how much will the firm produce?
b) how much is the firm's average total, average variable, and marginal costs?
c) how much is the firm's total, total variable, and total fixed costs?
d) how much is the firm's total revenue and economic profit?
e) what will happen in this market in the long run?
Definitions:
Return Ratio
A financial metric used to measure the efficiency or profitability of an investment, calculated by dividing the gain (or loss) from the investment by its cost.
Total Assets
The sum of all assets owned by an entity, including both current and long-term assets, representing the total value of what the entity owns.
Profitability
The ability of a firm to earn income.
Days' Sales
A financial metric that compares a company's average receivables to its average daily sales, indicating how fast the company collects payments from customers.
Q16: In perfect competition, the firm's marginal revenue
Q55: Adele's Springs produces a unique mineral water.
Q73: The law of diminishing returns states that
Q148: Health care costs rose more than 10
Q179: In the above table, diminishing marginal returns
Q207: The total output produced with any quantity
Q240: If the local cable TV company is
Q280: In the above figure, the line represented
Q334: Average product equals the<br>A) increase in output
Q524: A monopoly always operates on the elastic