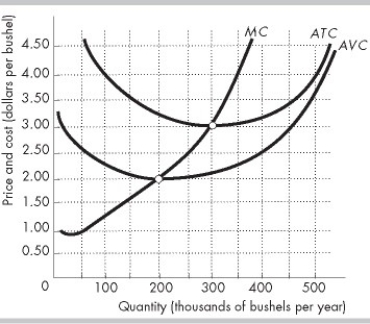
-The figure above shows a typical perfectly competitive corn farm, whose marginal cost curve is MC and average total cost curve is ATC. The market is initially in a long-run equilibrium, where the price is $3.00 per bushel. Then, the market demand for corn decreases and, in the short run, the price falls to $2.50 per bushel. In the new short-run equilibrium, the farm
Definitions:
Relationship Skills
Abilities important for forming, maintaining, and enhancing interpersonal relationships, including communication, empathy, and conflict resolution.
Boardroom
A room where a board of directors meets for its official business and decision-making processes.
Shop Floor
Refers to the production area of a manufacturing facility where goods are actually produced or assembled.
Giving Definition
The act of providing a clear, concise, and specific meaning or explanation of a concept, term, or phenomenon.
Q2: In perfect competition<br>A) many firms sell slightly
Q77: If the ATC curve has a positive
Q194: In perfect competition, each individual firm faces
Q218: The above figure shows the costs at
Q304: Based on the table above which shows
Q313: If marginal cost exceeds average variable cost,
Q329: The table above gives costs at Jan's
Q471: Which creates a larger deadweight loss, perfect
Q486: The figure above shows a perfectly competitive
Q488: A firm's long-run average cost curve<br>A) shows