 The figure above shows an economy's aggregate demand curve and aggregate supply curve.
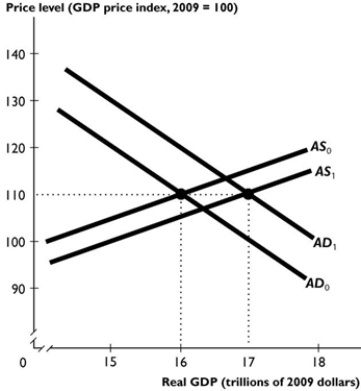
-Suppose the shift from AD0 to AD1 and from AS0 to AS1 in the figure above is the result of fiscal policy. Which of the policies below could lead to these shifts?
i. An increase in government expenditure
ii. A tax cut
iii. A decrease in government expenditure
iv. A tax increase
Definitions:
Sole Proprietorship
A business structure where a single individual both owns and runs the company, often leading to simpler administrative requirements but unlimited personal liability.
Government Regulations
Laws and rules established by governmental agencies that businesses must follow to ensure compliance with standards and protections for consumers, employees, and the environment.
Chief Accounting Officer
This is an executive role responsible for overseeing the accounting operations and financial reporting of a company.
Corporation
A legal entity that is separate from its owners, who own shares in the company and have limited liability.
Q2: Which of the following are assets of
Q4: In the figure above, the shift in
Q8: When a Chinese company purchases Australian iron
Q42: If the Reserve Bank is concerned about
Q54: The short-run tradeoff between the unemployment rate
Q55: In the foreign exchange market, which of
Q56: What is the infant-industry argument for protection
Q81: The Board of the Reserve Bank of
Q131: The law of demand implies that, other
Q134: Wheat is used to produce cereal. When