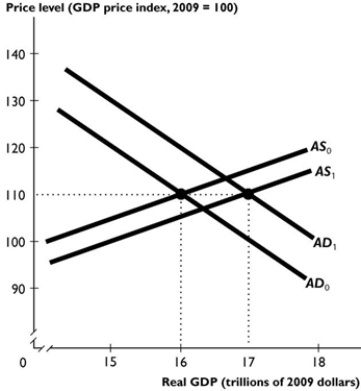
 The figure above shows an economy's aggregate demand curve and aggregate supply curve.
-Suppose the shift from AD0 to AD1 and from AS0 to AS1 is the result of fiscal policy. If the effect on aggregate supply was larger than the figure above shows, as a result the price level would be ________ 110 and real GDP would be ________ $17 trillion.
Definitions:
Net Income
Net income is the total earnings of a company after deducting all expenses, taxes, and losses, indicating the company's profitability over a specific period.
Ending Inventory
The value of the goods available for sale at the end of an accounting period.
FOB Destination
Freight terms in which the seller pays the transportation costs from the shipping point to the final destination.
Net Income
The total earnings of a company after deducting all expenses and taxes from total revenue.
Q2: The Reserve Bank raises the cash rate.
Q8: In calculating GDP, we must<br>A) add the
Q42: Wobet is a small country that produces
Q43: <img src="https://d2lvgg3v3hfg70.cloudfront.net/TB8401/.jpg" alt=" In the above
Q43: Based on the table above, during which
Q50: A reason why an increase in the
Q51: Which type of unemployment is a permanent
Q57: If the Chinese economy enters a recession,<br>A)
Q58: An increase in the Australian interest rate
Q61: In the figure above, the _ gap