Multiple Choice
 The figure above shows some Phillips curves for an economy.
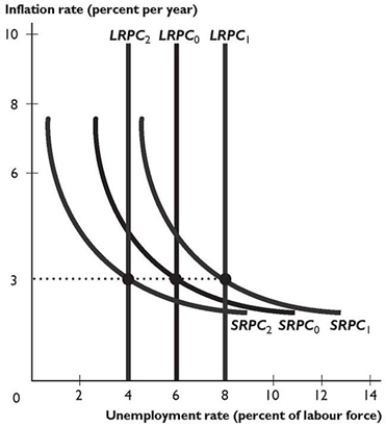
-Along the short-run Phillips curve SRPC2 in the figure above, the natural unemployment rate is
Definitions:
Related Questions
Q7: As we move along the production possibilities
Q15: Which of the following does NOT affect
Q25: The figure above shows the Australian demand
Q34: The above table has data from the
Q36: Goods and services that Australia buys from
Q41: <img src="https://d2lvgg3v3hfg70.cloudfront.net/TB8401/.jpg" alt=" In the above
Q43: The above table has data from the
Q44: If the Reserve Bank increases the quantity
Q54: If the AD curve shifts rightward while
Q81: Which components of aggregate expenditure change as