 The figure above shows some Phillips curves for an economy.
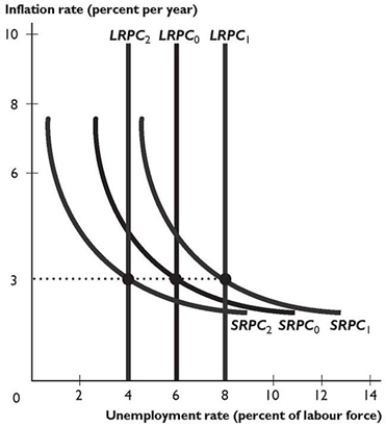
-In the figure above, the shift from the short-run Phillips curve SRPC0 and the long-run Phillips curve LRPC0 to the short-run Phillips curve SRPC1 and the long-run Phillips curve LRPC1 is the result of ________ in the expected inflation rate and ________ in the natural unemployment rate.
Definitions:
Q9: If the price is below the equilibrium
Q19: The aggregate demand curve in the figure
Q20: If the Australian interest rate differential decreases,
Q24: The personal distribution of income measures which
Q26: Which of the following produces a movement
Q29: If a higher price for wheat decreases
Q48: Because investment, consumption expenditure and net exports
Q58: Other things remaining the same, _ in
Q75: If the marginal propensity to import is
Q92: If the production possibilities frontier between two