Multiple Choice
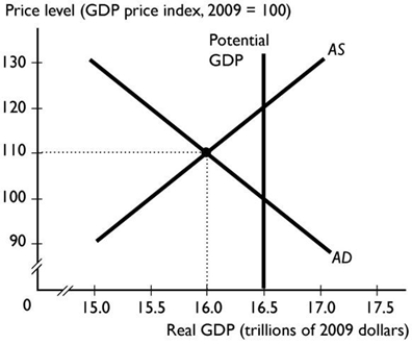
-In the figure above, the economy is at an equilibrium with real GDP of $16 trillion and a price level of 110. As the economy moves toward its ultimate equilibrium, the ________ curve shifts ________ because ________.
Definitions:
Related Questions
Q25: <img src="https://d2lvgg3v3hfg70.cloudfront.net/TB8401/.jpg" alt=" The slope of
Q36: In Germany, expected future income increased during
Q40: The AE curve illustrates the relationship between<br>A)
Q47: Which of the following is a limitation
Q61: The aggregate demand multiplier effect says that
Q69: A graph shows the price of a
Q70: A situation in which money buys the
Q78: If the price level increases from 110.0
Q85: If the price level increases, there is
Q149: The _ stage is when babies understand