The following transportation table shows the cost of shipping one unit from each source to each destination in the upper right-hand corner of each cell, as well as the supply capacities and demand requirements: 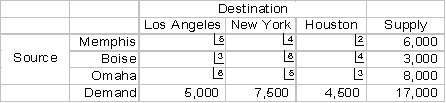 The optimal solution is:
 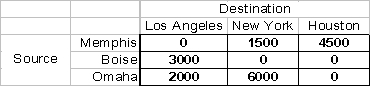 How many units of New York demand are supplied from Omaha?
Definitions:
Utility Function
A mathematical representation that describes how consumers allocate their spending to maximize satisfaction or utility from goods and services.
Course Grade
The evaluation or assessment of a student's performance in a course, typically represented as a letter or number.
Min/Max Function
A mathematical function that identifies the minimum or maximum value within a particular set of data or input.
Same Income
A scenario in which two or more entities earn or receive an identical amount of money.
Q7: To keep machines running, firms can use
Q7: At a Walmart store, simulation can be
Q17: Linear regression relates two variables using a
Q36: Discuss distribution strategies, systems, and processes.
Q42: An advantage of using a computer versus
Q43: The number of orders can be calculated
Q58: A firm has the following gross requirements
Q78: A company may purchase larger amounts of
Q79: Multiple regression analysis can be used to
Q83: The type of forecasting method selected depends