The following graphs show the frequency of the b+ allele over 20 generations in two populations of heterozygous flour beetles (data for a population of 10 individuals is shown in graph A; data for a population of 100 individuals is shown in graph B) . Why does the frequency of the b+ allele increase in both populations? 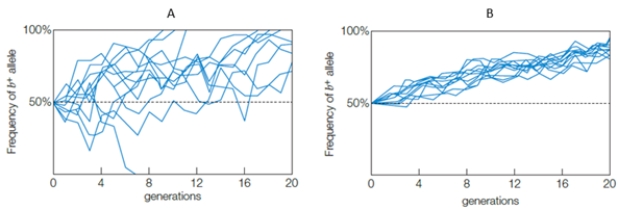
Definitions:
Q13: _ increases the frequency of adaptive mutations
Q26: What is the correct order of landmass
Q34: The leaves of ferns are called _.<br>A)
Q37: The niche of an earthworm in an
Q39: The difference between normal and sickle-cell hemoglobin
Q61: The mosses, hornworts, and liverworts are members
Q61: Which group of organisms has an exoskeleton?<br>A)
Q73: Which is a characteristic of malignant cells?<br>A)
Q76: Some _ have enzymes to break the
Q90: Land plants most likely evolved from _.<br>A)