Use the figures to answer the following question. 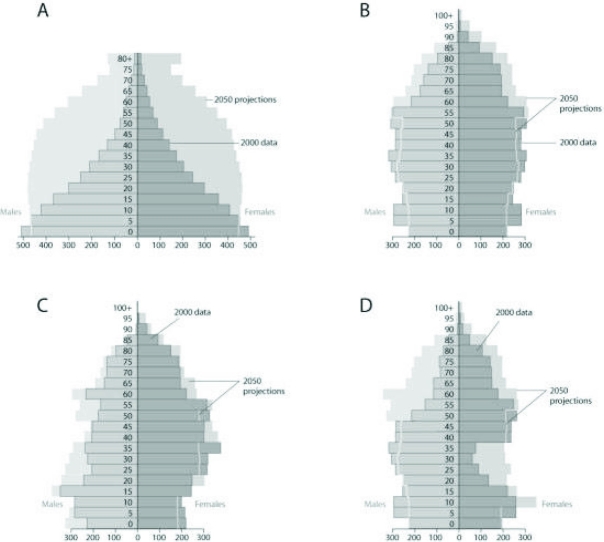 Based on the age-structure diagrams in the figure and on the large population of baby boomers (a demographic cohort born at a reproductive peak after World War II between 1946-1964 in the United States) , which graph best reflects U.S. population in 20 years?
Definitions:
Depression
A common but serious mood disorder that causes persistent feelings of sadness and loss of interest, affecting how one feels, thinks, and handles daily activities.
Failure to Thrive
A medical condition in infants and children characterized by insufficient weight gain or inappropriate weight loss.
Young Children
Individuals in the early stages of life, typically defined as being from birth to 8 years old, experiencing rapid physical, cognitive, and emotional development.
Speech Development
The process by which children learn to communicate and express themselves through spoken language, including the acquisition of words, sentences, and conversational skills.
Q8: Which of the following are possible base
Q17: Which of the following best explains the
Q21: In which of the following circumstances would
Q24: An ecologist recorded 12 white-tailed deer, Odocoileus
Q25: Listed below are four types of animal
Q26: Which of the following protects both the
Q38: Which of the following statements best describes
Q48: Use the figure to answer the following
Q50: Which of the following describes the change
Q58: If an enzyme in solution is saturated