Use the following figures to answer the question below. The diagram is a climograph, which depicts the most likely overlap between mean temperatures and precipitation values that result in the given types of biomes. 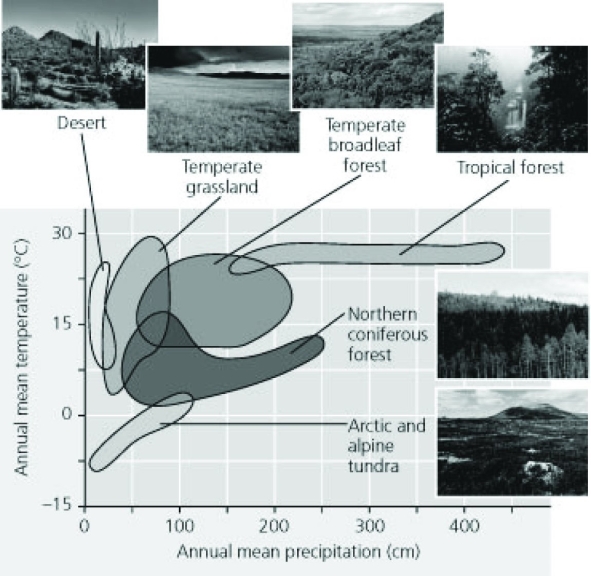 East of the Mississippi River in Hopkinsville, Kentucky, the mean annual precipitation is 130cm. The mean annual temperature is 14.3°C. In the winter, the mean temperature is 7.3°C, while in summer it is 20.6°C. Using the climograph shown here, the biome found in Hopkinsville is most likely a ________.
Definitions:
ROE
Equity Return, which determines financial success by dividing the net income by the equity of the shareholders.
Short-Term Debt
Debts or loans that are due for repayment within one year.
Blanket Inventory Lien
A security interest granted by a borrower to a lender, covering all of the borrower's inventory.
Revolving Line of Credit
A credit facility extended by a financial institution to a client that allows the borrower to draw, repay, and redraw loans advanced to them up to a specified maximum amount.
Q3: Use the following diagram of five islands
Q4: For which of the following do experiments
Q19: If global warming continues at its present
Q21: The ΔG of ATP hydrolysis in a
Q27: Which of the following changes is most
Q30: Which of the following criteria must be
Q39: Use the following information to answer the
Q51: The most plausible hypothesis to explain why
Q58: Which of the following is a primary
Q73: Based on current growth rates, Earth's human