The eight panels below show average climatic values across the year on a monthly basis, as represented by first letter of each month depicted on the x-axis. Temperature values are depicted as a line graph and represented by the left vertical axis, while precipitation values are depicted as a bar graph and represented by the right vertical axis. 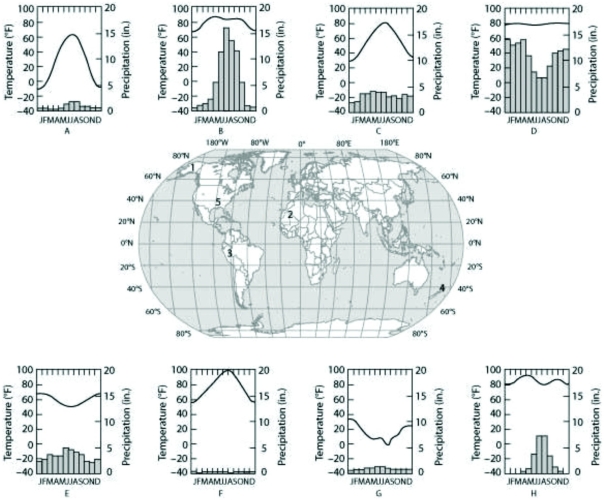 Which panel (A-H) most likely depicts the climate for location 2 as shown on the map in the center panel?
Definitions:
Q3: Which answer describes an advantage of having
Q12: Under which of the following conditions will
Q14: Which part(s) of your brain are most
Q32: In the olfactory receptor cells of mammals,
Q33: A series of enzymes catalyze the reactions
Q39: Use the following information to answer the
Q39: Studies, in which researchers compare the behavior
Q48: An organism that lacks their thymus would
Q49: Which of the following best describes an
Q64: What does the bobbing of a lizard's