Figure 19-2
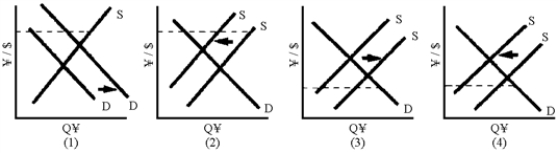
-Of the graphs in Figure 19-2, where the broken line represents the fixed exchange rates, which one shows how a balance of payments deficit could be reduced through a recession in Japan?
Definitions:
Resource Allocation
The process of distributing available resources among various projects or business units to maximize the efficiency and performance of the organization.
Marginal Cost
The cost of producing one additional unit of a product, considering the costs of all resources involved.
Price Exceeds
A situation where the price of a good or service surpasses a certain threshold, often leading to economic implications such as reduced demand or market imbalance.
Pure Monopolist
A market scenario where a single company or entity solely controls the entire market for a particular product or service, with no close substitutes.
Q3: Under the Bretton Woods system of fixed
Q21: When positive network effects are present, platform
Q35: The main international repercussion of either a
Q51: If European economies experience a strong economic
Q68: Why is monetary policy more effective in
Q78: A reduction in net exports shifts the
Q84: Balance of payments surpluses arise whenever the
Q111: The main reason why the economy's aggregate
Q164: Which of the following companies would gain
Q211: Variability in exchange rates of currencies used