Multiple Choice
Figure 33-5
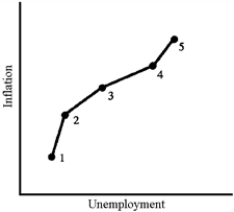
-The data illustrated in Figure 33-5 would be most representative of which of the following decades?
Definitions:
Related Questions
Q5: The advantage of a system of fixed
Q17: The official fiscal year budget deficits disappeared
Q58: Monetarism resembles Keynesian thinking in that they
Q58: Which of the following positions would a
Q74: When something happens to the economy, monetarists
Q95: Self-sufficiency is the best way to increase
Q118: A country with an overvalued currency<br>A)will have
Q120: According to the Phillips curve, in the
Q139: During the late 1980s and early 1990s,
Q167: The federal budget deficit in 2009 was