Multiple Choice
Figure 11-2
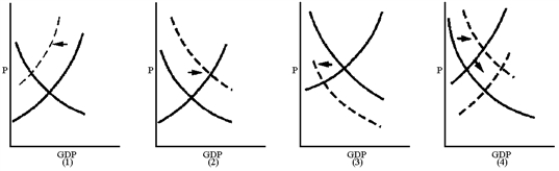
-Which graph in Figure 11-2 best reflects a supply-sider's view of the impact of an increase in the personal income tax rate?
Definitions:
Related Questions
Q15: Taxes are not considered a leakage because
Q17: An increase in government expenditures is an
Q43: In 1986, OPEC countries increased their production
Q44: If the federal government increases the amount
Q152: From the mid-1980s until late 2007, many
Q162: The personal income tax varies as GDP
Q192: The reserves supply schedule has a positive
Q196: One of the practical issues in the
Q203: Conservatives usually favor increasing government spending to
Q215: In Figure 10-1, what is the equilibrium