Figure 7-13 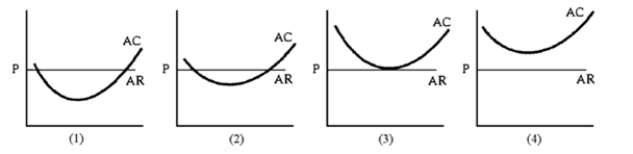
-Figure 7-13 shows the average total cost curves of four firms that produce milk.Some of the dairies are more productive.AR = P is the long-run price of milk.How many of these dairies will remain in the industry in the long run?
Definitions:
Income Effect
The change in consumers' purchasing power and consequently the quantity demanded of a good or service, prompted by a change in real income.
Opportunity Cost
Missing the chance to profit from several alternative options by deciding on one.
Hourly Wage Rate
The amount of money paid for each hour of work, commonly used to compensate employees in many occupations.
Marginal Utility
The augmented enjoyment or usefulness that comes from the consumption of an additional unit of a product or service.
Q2: As a general rule, consumers have<br>A)limited income.<br>B)unlimited
Q29: Total fixed cost<br>A)increases as output increases.<br>B)declines as
Q33: Big Alice Ice Cream Parlor reduced its
Q45: A vertical demand curve has an elasticity
Q58: The elasticity of any demand curve is
Q97: Given a demand curve, explain how total
Q116: A good will tend to be more
Q173: Marginal profit is the additional profit that
Q196: Which of the following is more likely
Q200: .In Figure 7-1, which graph best represents