Multiple Choice
The plots shown here are normal probability plots for random samples of 65 healthy male and 65 healthy female body temperatures. 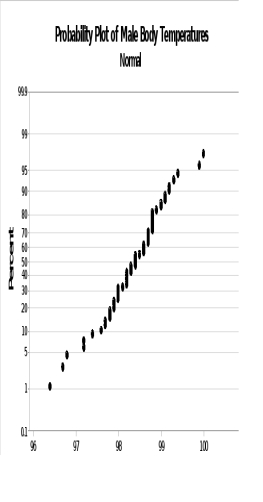
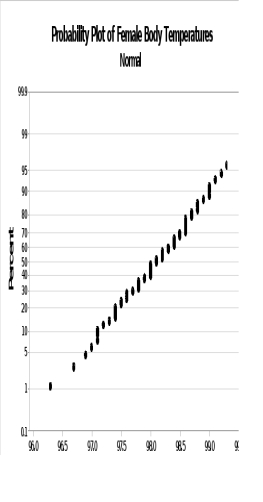 Which group is more likely to be normally distributed?
Definitions:
Related Questions
Q3: In a recent production batch of automobiles,
Q15: A 99% confidence interval for the population
Q19: In a chi-square test for homogeneity, the
Q26: Edward took out a second mortgage on
Q27: The _ test is appropriate for testing
Q28: An athletic trainer is concerned that his
Q29: Concerning the sampling distribution of <img src="https://d2lvgg3v3hfg70.cloudfront.net/TB8195/.jpg"
Q52: A recent demographic study conducted in the
Q54: When Sally realised her vintage clothing pieces
Q54: An example of a small business that