TABLE 2-18
The stem-and-leaf display below shows the result of a survey on 50 students on their satisfaction with their school with the higher scores represent higher level of satisfaction.
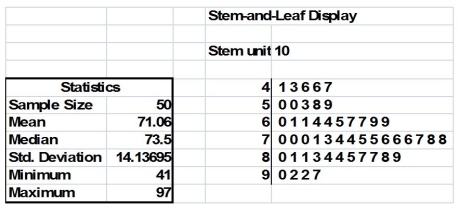
-Referring to Table 2-18, if a student is randomly selected, his/her most likely level of satisfaction among the 40s, 50s, 60s, 70s, 80s and 90s will be in the 70s.
Definitions:
Observations
Data collected or measured during an experiment or survey.
Measurements
Measurements refer to the size, length, or amount of something, determined through quantitative comparison with a standard unit.
Element
A fundamental or essential constituent of a composite entity; in contexts like chemistry, an element is a substance that cannot be broken down into simpler substances by chemical means.
Variable
A feature or characteristic that can vary among individuals or over time.
Q3: A client states that she rates her
Q4: If P(A and B)= 0, then A
Q31: Referring to Table 4-2, what is the
Q39: Referring to Table 1-1, the possible responses
Q39: Referring to Table 5-8, what is the
Q77: Referring to Table 3-3, construct a boxplot
Q81: Referring to Table 4-10, if a randomly
Q95: The on-line access computer service industry is
Q103: Referring to Table 5-2, the probability that
Q118: Student grades (A to F)are an example