TABLE 2-3
Every spring semester, the School of Business coordinates a luncheon with local business leaders for graduating seniors, their families, and friends. Corporate sponsorship pays for the lunches of each of the seniors, but students have to purchase tickets to cover the cost of lunches served to guests they bring with them. The following histogram represents the attendance at the senior luncheon, where X is the number of guests each graduating senior invited to the luncheon and f is the number of graduating seniors in each category.
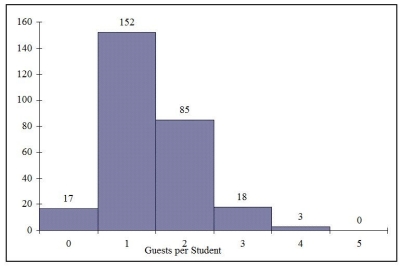
-Referring to the histogram from Table 2-3, how many graduating seniors attended the luncheon?
Definitions:
Total Value
The overall value of an asset, investment, or portfolio, taking into account all relevant financial factors.
Utility
An indicator of pleasure, contentment, or advantage gained by a person from the use of products and services.
Productivity
The efficiency at which goods or services are produced, often measured as the ratio of output to inputs in the production process.
Separating Equilibrium
A situation in game theory where different types of players choose different strategies, allowing them to be distinguished based on their actions.
Q2: A nurse cares for a client who
Q11: Referring to Table 4-1, given alcohol was
Q11: A nurse cares for a client newly
Q15: A nurse contacts the health care provider
Q24: A client is placed on fluid restrictions
Q25: A nurse is caring for a client
Q30: Given below is the scatter plot of
Q75: The Dean of Students conducted a survey
Q117: Referring to Table 3-3, the coefficient of
Q164: Referring to Table 2-11, if a frequency