TABLE 10-19
An agronomist wants to compare the crop yield of 3 varieties of chickpea seeds. She plants 15 fields, 5 with each variety. She then measures the crop yield in bushels per acre. Treating this as a completely randomized design, the results are presented in the table that follows.
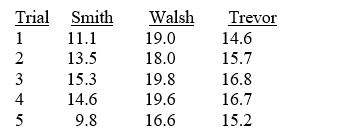
-Referring to Table 10-19, the agronomist decided to compare the three treatment means by using the Tukey-Kramer procedure with an overall level of significance of 0.01. There are ________ pairwise comparisons that can be made.
Definitions:
Normally Distributed
Describes a data set whose distribution forms a symmetric, bell-shaped curve around the mean.
Top 10%
A term used to denote the upper 10 percentile of a data set or distribution, representing values higher than 90% of the others.
Hypothesized Population Mean
A specific value that represents the average outcome we propose or expect for a population in hypothesis testing.
Standard Deviation
A measure of the amount of variation or dispersion of a set of values, indicating how much the values in the data set deviate from the mean.
Q7: Referring to Table 12-5, the estimates of
Q19: Repeated measurements from the same individuals is
Q41: "What conclusions and interpretations can you reach
Q50: Referring to Table 9-6, if the test
Q53: Referring to Table 9-1, what critical value
Q61: The value that separates a rejection region
Q79: Referring to Table 10-17, the within group
Q128: If the p-value is less than α
Q208: Referring to Table 12-11, which of the
Q287: The variation attributable to factors other than