TABLE 11-10
One criterion used to evaluate employees in the assembly section of a large factory is the number of defective pieces per 1,000 parts produced. The quality control department wants to find out whether there is a relationship between years of experience and defect rate. Since the job is repetitious, after the initial training period, any improvement due to a learning effect might be offset by a loss of motivation. A defect rate is calculated for each worker in a yearly evaluation. The results for 100 workers are given in the table below.
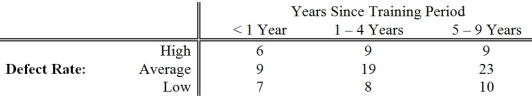
-Referring to Table 11-10, a test was conducted to determine if a relationship exists between defect rate and years of experience. Which of the following p-values would indicate that defect rate and years of experience are dependent? Assume you are testing at α = 0.05.
Definitions:
Proportions
The relationship between parts and a whole in terms of size, quantity, or degree.
Factor 2
A component or element that contributes to a particular result or situation.
Profit
The financial gain obtained when the amount earned from a business activity exceeds the expenses, costs, and taxes needed to sustain the activity.
Marginal Product
Marginal product is the additional output resulting from the use of one more unit of a variable input, holding other inputs constant.
Q1: Referring to Table 11-6, what is the
Q33: Referring to Table 10-2, what is the
Q50: Referring to Table 12-12, to test the
Q61: Referring to Table 11-1, the company tests
Q68: Referring to Table 13-15, what is the
Q139: Testing for the existence of correlation is
Q165: Referring to Table 12-3, the coefficient of
Q213: Referring to Table 12-3, suppose the director
Q243: Referring to Table 13-2, for these data,
Q262: Referring to Table 10-11, the same decision