TABLE 12-3
The director of cooperative education at a state college wants to examine the effect of cooperative education job experience on marketability in the work place. She takes a random sample of four students. For these four, she finds out how many times each had a cooperative education job and how many job offers they received upon graduation. These data are presented in the table below.
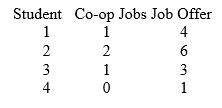
-Referring to Table 12-3, the director of cooperative education wanted to test the hypothesis that the population slope was equal to 3.0. The p-value of the test is between ________ and ________.
Definitions:
Probability Distribution
A mathematical description of a random phenomenon in terms of the probabilities of various possible outcomes.
Sample Size
The number of observations or data points collected in a sample from a population.
Standard Error
The standard deviation of the sampling distribution of a statistic, often used to measure the accuracy of an estimate.
Positively Skewed Distribution
A distribution where more values fall to the left side of the mean, causing a long tail on the right, indicating that the median is less than the mean.
Q28: The coefficient of determination represents the ratio
Q29: Referring to Table 10-8, suppose that the
Q39: Referring to Table 14-1, what is the
Q44: Referring to Table 12-10, 93.98% of the
Q137: The Wall Street Journal recently ran an
Q161: Referring to Table 10-18, the null hypothesis
Q172: Referring to Table 13-15, which of the
Q188: Referring to Table 12-10, the value of
Q234: When testing H₀: π₁ - π₂ ≥
Q260: The Wall Street Journal recently ran an