TABLE 12-8
It is believed that GPA (grade point average, based on a four-point scale) should have a positive linear relationship with ACT scores. Given below is the Microsoft Excel output for predicting GPA using ACT scores based a data set of eight randomly chosen students from a Big Ten university.
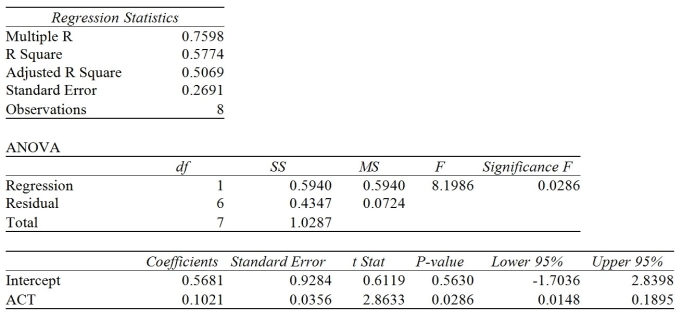
-Referring to Table 12-8, the value of the measured (observed) test statistic of the F test for H₀: β₁ = 0 vs. H₁: β₁ = 0
Definitions:
Q1: Referring to Table 13-17 Model 1, which
Q58: Referring to Table 12-12, the error sum
Q85: Referring to Table 10-12, construct a 95%
Q91: In what type of test is the
Q117: Referring to Table 12-3, the director of
Q134: Referring to Table 10-5, the value of
Q136: Referring to Table 12-4, the managers of
Q210: Referring to Table 10-19, the test is
Q223: Referring to Table 10-4, the pooled (i.e.,
Q259: A multiple regression is called "multiple" because