TABLE 12-11
A computer software developer would like to use the number of downloads (in thousands) for the trial version of his new shareware to predict the amount of revenue (in thousands of dollars) he can make on the full version of the new shareware. Following is the output from a simple linear regression along with the residual plot and normal probability plot obtained from a data set of 30 different sharewares that he has developed:
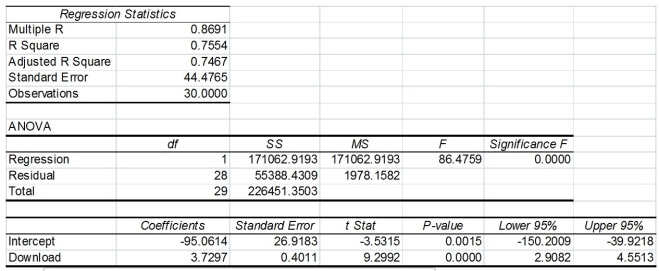
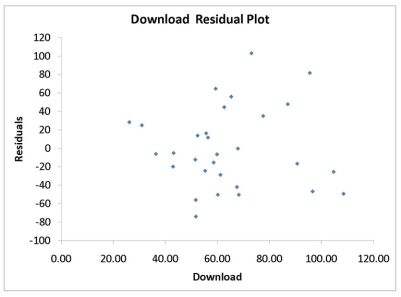
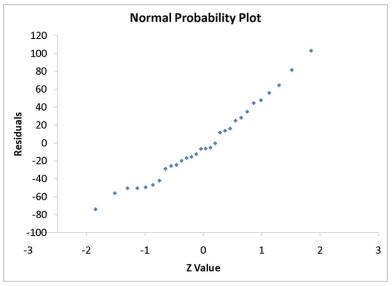
-Referring to Table 12-11, there appears to be autocorrelation in the residuals.
Definitions:
Profit Sharing
A company policy or agreement that distributes a portion of its profits among employees, typically based on their performance or salary.
Total Cost Function
A mathematical representation of how a firm's total cost varies with its level of output.
Optimal Output Level
The quantity of production that results in the highest possible profit for the firm, considering the cost of resources and the revenue from sales.
High Quality Trips
Travel experiences characterized by superior accommodations, services, and attention to detail.
Q9: Referring to Table 11-8, at 5% level
Q32: If the Durbin-Watson statistic has a value
Q37: Referring to Table 11-11, the alternative hypothesis
Q107: Referring to Table 11-7, the test will
Q113: Referring to Table 13-3, to test whether
Q147: Referring to Table 12-13, the p-value of
Q154: Referring to Table 10-12, construct a 99%
Q192: Referring to Table 10-11, construct a 95%
Q260: Referring to Table 13-16, there is enough
Q262: Referring to Table 13-16, the 0 to