TABLE 12-11
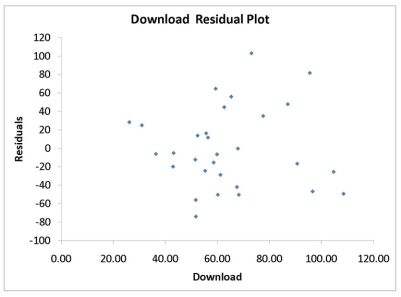
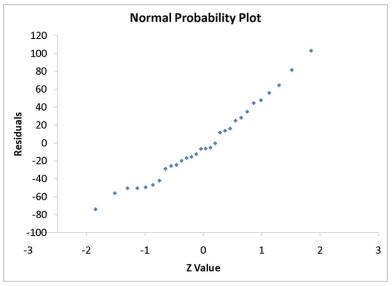
A computer software developer would like to use the number of downloads (in thousands) for the trial version of his new shareware to predict the amount of revenue (in thousands of dollars) he can make on the full version of the new shareware. Following is the output from a simple linear regression along with the residual plot and normal probability plot obtained from a data set of 30 different sharewares that he has developed:
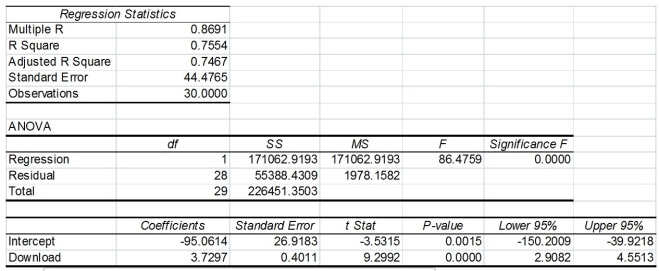
-Referring to Table 12-11, the null hypothesis for testing whether there is a linear relationship between revenue and the number of downloads is "There is no linear relationship between revenue and the number of downloads".
Definitions:
Federal Taxes
Federal taxes are financial charges imposed by a government on individuals, corporations, and other entities' income, property, or transactions to fund public services and obligations.
Regressive
A term referring to a tax system where the tax rate decreases as the amount subject to taxation increases, often disproportionately affecting lower-income individuals.
Value-Added Tax
A consumption tax placed on a product whenever value is added at a stage of production and at the point of retail sale.
United States
A country in North America consisting of 50 states, a federal district, five major self-governing territories, and various possessions.
Q31: Referring to Table 13-7, the department head
Q77: Referring to Table 12-1, a 95% confidence
Q108: Referring to Table 12-10, what are the
Q121: Referring to Table 12-4, the prediction for
Q146: Referring to Table 13-10, to test the
Q159: The Y-intercept (b₀)represents the<br>A) estimated average Y
Q166: The Wall Street Journal recently ran an
Q167: Referring to Table 10-19, the agronomist decided
Q198: Regression analysis is used for prediction, while
Q282: A regression had the following results: SST