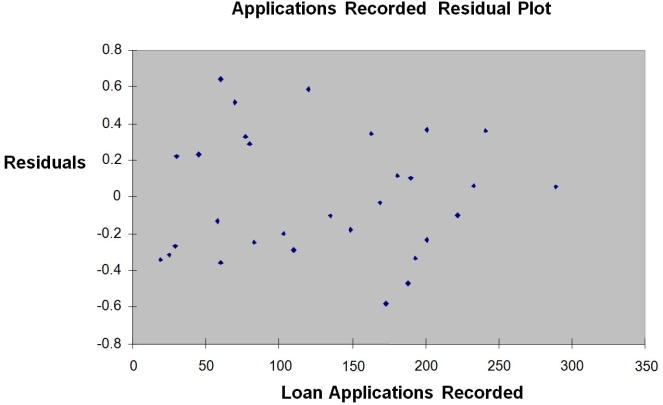
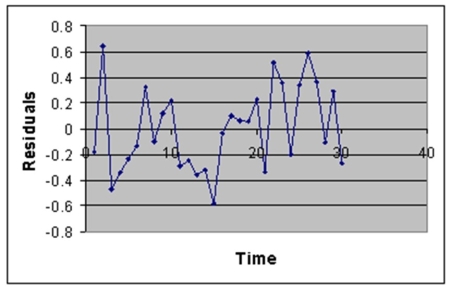
TABLE 12-12
The manager of the purchasing department of a large savings and loan organization would like to develop a model to predict the amount of time (measured in hours) it takes to record a loan application. Data are collected from a sample of 30 days, and the number of applications recorded and completion time in hours is recorded. Below is the regression output:
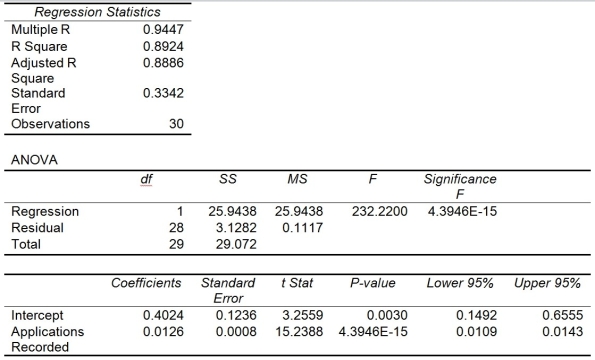
Note: 4.3946E-15 is 4.3946 x 10⁻¹⁵.
-Referring to Table 12-12, the value of the measured t test statistic to test whether the amount of time depends linearly on the number of loan applications recorded is ________.
Definitions:
Presentation
A formal or informal display of information, often involving speaking to an audience and using visual aids, to inform, persuade, or entertain.
Feedback
Feedback from recipients about the effectiveness and quality of a message.
Online
Connected to or available through the internet.
Visual Cues
Non-verbal signals or indicators, such as images, symbols, or colors, used to communicate information or instructions.
Q4: Referring to Table 14-8, an <img src="https://d2lvgg3v3hfg70.cloudfront.net/TB2694/.jpg"
Q15: Referring to Table 12-11, which of the
Q18: What do compensation managers use to recognize
Q31: Referring to Table 13-7, the department head
Q54: Referring to Table 13-8, the analyst wants
Q95: Referring to Table 10-10, if the firm
Q170: Referring to Table 12-11, what is the
Q194: Referring to Table 10-8, suppose Pepsi wanted
Q237: Referring to Table 10-18, based on the
Q238: Referring to Table 10-18, construct the ANOVA