TABLE 12-10
The management of a chain electronic store would like to develop a model for predicting the weekly sales (in thousand of dollars) for individual stores based on the number of customers who made purchases. A random sample of 12 stores yields the following results:
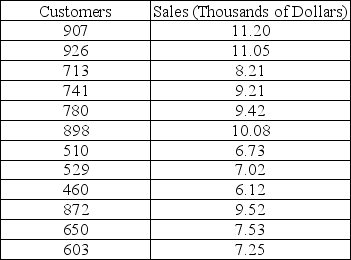
-Referring to Table 12-10, what is the p-value of the t test statistic when testing whether the number of customers who make a purchase affects weekly sales?
Definitions:
Normal Distribution
This denotes a probability distribution with symmetry at the mean, proving that nearer-to-mean data points occur more regularly than those farther away.
Mean
The mean of a collection of numbers, found by dividing their total sum by the quantity of numbers in the set.
μ
The symbol commonly used to represent the mean or average of a population in statistics.
σ
Represents the standard deviation of a population in statistics, measuring the dispersion of dataset values from the mean.
Q18: Referring to Table 11-3, the expected cell
Q50: Referring to Table 12-12, to test the
Q71: Referring to Table 14-9, an <img src="https://d2lvgg3v3hfg70.cloudfront.net/TB2694/.jpg"
Q77: Referring to Table 12-1, a 95% confidence
Q109: Referring to Table 12-5, the coefficient of
Q113: Referring to Table 13-3, to test whether
Q128: Referring to Table 10-17, what should be
Q183: Referring to Table 13-16, what is the
Q198: Referring to Table 13-5, suppose the microeconomist
Q243: Referring to Table 13-2, for these data,