TABLE 12-10
The management of a chain electronic store would like to develop a model for predicting the weekly sales (in thousand of dollars) for individual stores based on the number of customers who made purchases. A random sample of 12 stores yields the following results:
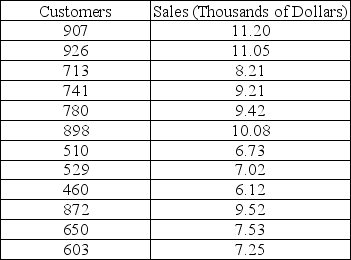
-Referring to Table 12-10, the null hypothesis for testing whether the number of customers who make a purchase effects weekly sales cannot be rejected if a 1% probability of committing a Type I error is desired.
Definitions:
Probability Samples
Sampling methods in research that give each member of a population a known chance of being selected, facilitating the generalization of results to the larger population.
Randomization Techniques
Statistical methods used to ensure each participant in an experiment has an equal chance of being assigned to any group, reducing bias.
Representative Sample
A subset of a population that accurately reflects the members of the entire population, used in statistical analysis or research studies.
Sampling Frame
A list or database from which a sample is drawn for a study, representing the entire population of interest.
Q8: Referring to Table 10-19, the value of
Q57: Referring to Table 11-9, at 5% level
Q65: Referring to Table 14-9, an R chart
Q72: Referring to Table 13-17 Model 1, the
Q80: Referring to Table 10-10, what is/are the
Q97: Referring to Table 12-12, the p-value of
Q103: Referring to Table 13-4, suppose the builder
Q132: Referring to Table 12-11, predict the revenue
Q217: The F test in a completely randomized
Q280: Referring to Table 10-17, the among group