For Questions , use the following narrative
Narrative: Crickets and temperature
A researcher wants to explore the relationship between cricket chirps and temperature.The following scatterplot shows data collected over a random sample of 8 days.Each day, the temperature was recorded, as well as the number of times a cricket chirped in 15 seconds.The correlation was found to be over .90.The least squares line was found to be Temperature (in Fahrenheit) = 40 + 1.0 × (#Chirps in 15 seconds). 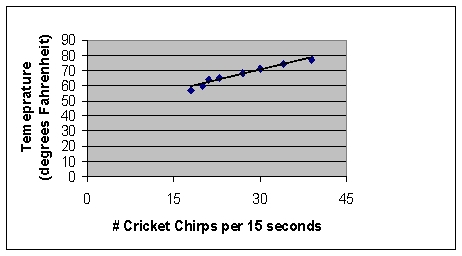
-{Crickets and temperature narrative} On nights when crickets chirp 120 times per minute, what do you predict the temperature to be, on average?
Definitions:
Q11: Even in a well designed experiment, there
Q16: {Quiz scores narrative} Find the three measures
Q17: Which symptom is NOT a typical indicator
Q21: Give an example where the response variable
Q21: The main distinction between the terms crowding
Q25: A data set is _ if the
Q31: A statistical picture isn't worth much if
Q35: In which of the following situations does
Q37: If you weighed yourself using a bathroom
Q47: If numerous large random samples or repetitions