TABLE 13-3
An economist is interested to see how consumption for an economy (in $billions) is influenced by gross domestic product ($billions) and aggregate price (consumer price index) . The Microsoft Excel output of this regression is partially reproduced below.
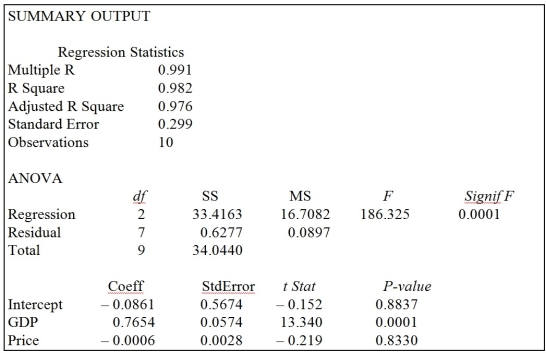
-Referring to Table 13-3, when the economist used a simple linear regression model with consumption as the dependent variable and GDP as the independent variable, he obtained an r² value of 0.971. What additional percentage of the total variation of consumption has been explained by including aggregate prices in the multiple regression?
Definitions:
Degree Of Operating Leverage
A measure of how sensitive a company's operating income is to a change in its sales volume, indicating financial risk.
Net Present Value
A method used in capital budgeting to evaluate the profitability of an investment by calculating the present value of all future cash flows minus the initial investment cost.
Simulation Analysis
is a method used in risk management to model possible outcomes of a decision by manipulating variables within mathematical or computer simulations.
NPV Estimates
Projections or calculations of the Net Present Value for different investments or projects to aid in decision-making.
Q15: Pertaining to CEO compensation,under classic economic theory,which
Q33: Referring to Table 13-16, which of the
Q43: Referring to Table 14-5, the process seems
Q59: In calculating the standard error of the
Q60: Changes in the system to reduce common
Q82: The interpretation of the slope is different
Q88: Referring to Table 12-13, what percentage of
Q106: Referring to Table 13-16, which of the
Q130: The statistical distribution used for testing the
Q221: Referring to Table 10-17, the null hypothesis