TABLE 13-3
An economist is interested to see how consumption for an economy (in $billions) is influenced by gross domestic product ($billions) and aggregate price (consumer price index) . The Microsoft Excel output of this regression is partially reproduced below.
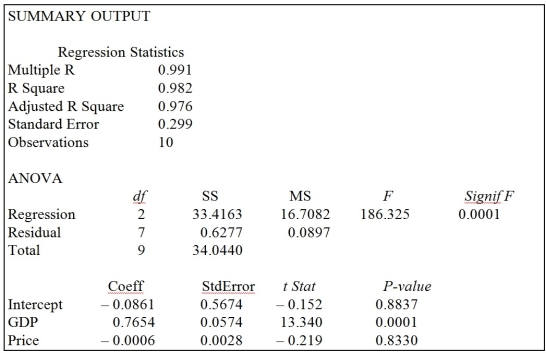
-Referring to Table 13-3, what is the estimated mean consumption level for an economy with GDP equal to $4 billion and an aggregate price index of 150?
Definitions:
Variable Cost
Expenses that change in proportion to the amount of production or output levels.
Sensitivity Analysis
A technique used to determine how different values of an independent variable affect a particular dependent variable under a given set of assumptions.
Fixed Costs
Expenses that do not change with the amount of goods or services produced, such as rent, salaries, or insurance.
Variable Cost
Costs that change in proportion to the goods or services that a business produces.
Q58: The purpose of a control chart is
Q80: Referring to Table 12-9, the 90% confidence
Q92: Referring to Table 11-6, the assumptions needed
Q98: In a one-way ANOVA, if the computed
Q98: Referring to Table 12-4, the error or
Q117: Referring to Table 12-3, the director of
Q134: Referring to Table 13-7, the department head
Q198: Regression analysis is used for prediction, while
Q219: Referring to Table 13-10, the total degrees
Q224: Referring to Table 13-10, the multiple regression