TABLE 13-3
An economist is interested to see how consumption for an economy (in $billions) is influenced by gross domestic product ($billions) and aggregate price (consumer price index) . The Microsoft Excel output of this regression is partially reproduced below.
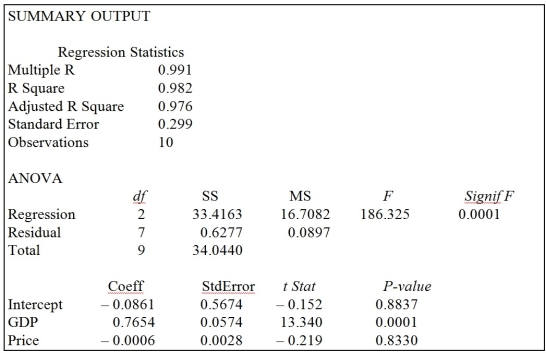
-Referring to Table 13-3, one economy in the sample had an aggregate consumption level of $3 billion, a GDP of $3.5 billion, and an aggregate price level of 125. What is the residual for this data point?
Definitions:
MPC (Marginal Propensity To Consume)
Measures the proportion of additional income that a consumer spends on goods and services rather than saving.
GDP
GDP stands for Gross Domestic Product, which is an indicator of a nation's economic health, calculated by adding up the value of every good and service produced for a certain period.
Multiplier
A factor that quantifies the additional economic impact of spending; it measures by how much a change in investment or government spending will affect the total economic output.
MPC (Marginal Propensity To Consume)
The proportion of additional income that an individual consumes rather than saving.
Q7: Referring to Table 13-17 Model 1, the
Q20: Referring to Table 14-4, what is the
Q27: Which of the following is the difference
Q55: Referring to Table 12-4, the coefficient of
Q70: Referring to Table 14-6, a p control
Q87: Referring to Table 13-15, which of the
Q100: Referring to Table 12-12, there is a
Q121: Referring to Table 13-7, the department head
Q126: Referring to Table 13-15, what is the
Q200: Referring to Table 13-17 Model 1, which