Examlex

Solved

TABLE 13-15 the Superintendent of a School District Wanted to Predict the Predict

question 289

True/False

TABLE 13-15
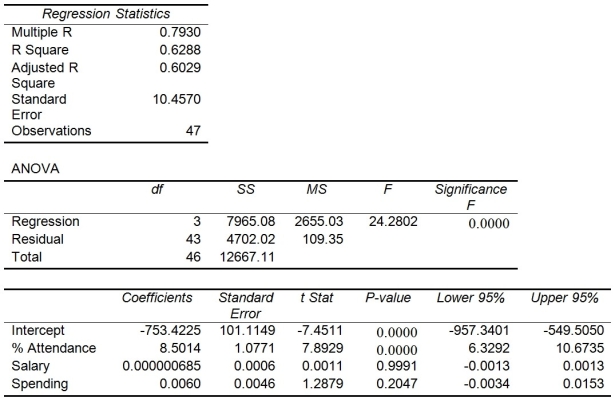
The superintendent of a school district wanted to predict the percentage of students passing a sixth-grade proficiency test. She obtained the data on percentage of students passing the proficiency test (% Passing), daily mean of the percentage of students attending class (% Attendance), mean teacher salary in dollars (Salaries), and instructional spending per pupil in dollars (Spending) of 47 schools in the state.
Following is the multiple regression output with Y = % Passing as the dependent variable, TABLE 13-15 The superintendent of a school district wanted to predict the percentage of students passing a sixth-grade proficiency test. She obtained the data on percentage of students passing the proficiency test (% Passing), daily mean of the percentage of students attending class (% Attendance), mean teacher salary in dollars (Salaries), and instructional spending per pupil in dollars (Spending) of 47 schools in the state. Following is the multiple regression output with Y = % Passing as the dependent variable,   = : % Attendance,   = Salaries and   = Spending:    -Referring to Table 13-15, there is sufficient evidence that daily mean of the percentage of students attending class has an effect on percentage of students passing the proficiency test, while holding constant the effect of all the other independent variables at a 5% level of significance. = : % Attendance, TABLE 13-15 The superintendent of a school district wanted to predict the percentage of students passing a sixth-grade proficiency test. She obtained the data on percentage of students passing the proficiency test (% Passing), daily mean of the percentage of students attending class (% Attendance), mean teacher salary in dollars (Salaries), and instructional spending per pupil in dollars (Spending) of 47 schools in the state. Following is the multiple regression output with Y = % Passing as the dependent variable,   = : % Attendance,   = Salaries and   = Spending:    -Referring to Table 13-15, there is sufficient evidence that daily mean of the percentage of students attending class has an effect on percentage of students passing the proficiency test, while holding constant the effect of all the other independent variables at a 5% level of significance. = Salaries and TABLE 13-15 The superintendent of a school district wanted to predict the percentage of students passing a sixth-grade proficiency test. She obtained the data on percentage of students passing the proficiency test (% Passing), daily mean of the percentage of students attending class (% Attendance), mean teacher salary in dollars (Salaries), and instructional spending per pupil in dollars (Spending) of 47 schools in the state. Following is the multiple regression output with Y = % Passing as the dependent variable,   = : % Attendance,   = Salaries and   = Spending:    -Referring to Table 13-15, there is sufficient evidence that daily mean of the percentage of students attending class has an effect on percentage of students passing the proficiency test, while holding constant the effect of all the other independent variables at a 5% level of significance. = Spending:
TABLE 13-15 The superintendent of a school district wanted to predict the percentage of students passing a sixth-grade proficiency test. She obtained the data on percentage of students passing the proficiency test (% Passing), daily mean of the percentage of students attending class (% Attendance), mean teacher salary in dollars (Salaries), and instructional spending per pupil in dollars (Spending) of 47 schools in the state. Following is the multiple regression output with Y = % Passing as the dependent variable,   = : % Attendance,   = Salaries and   = Spending:    -Referring to Table 13-15, there is sufficient evidence that daily mean of the percentage of students attending class has an effect on percentage of students passing the proficiency test, while holding constant the effect of all the other independent variables at a 5% level of significance.
-Referring to Table 13-15, there is sufficient evidence that daily mean of the percentage of students attending class has an effect on percentage of students passing the proficiency test, while holding constant the effect of all the other independent variables at a 5% level of significance.

Identify strategies for meal planning and making healthy snack choices.
Recognize the importance of portion control in achieving a healthy diet and managing weight.
Understand the basics of nutrition related to weight loss, eating disorders, and exercise.
Understand the basic concepts and theories related to the expression and perception of emotions.

Definitions:

Related Questions