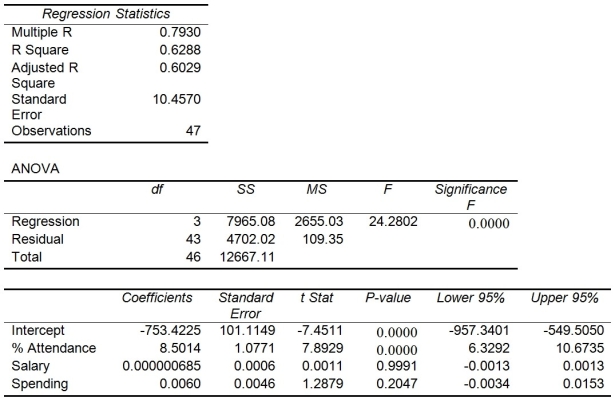
TABLE 13-15
The superintendent of a school district wanted to predict the percentage of students passing a sixth-grade proficiency test. She obtained the data on percentage of students passing the proficiency test (% Passing), daily mean of the percentage of students attending class (% Attendance), mean teacher salary in dollars (Salaries), and instructional spending per pupil in dollars (Spending) of 47 schools in the state.
Following is the multiple regression output with Y = % Passing as the dependent variable,  = : % Attendance,
  = Salaries and
  = Spending:

-Referring to Table 13-15, the null hypothesis H₀: β₁ = β₂ = β₃ = 0 implies that percentage of students passing the proficiency test is not related to any of the explanatory variables.
Definitions:
Hypothesis
A proposed explanation made on the basis of limited evidence as a starting point for further investigation.
Evidence
Information or facts that are used to support the validity of a statement or argument.
Interpretation
An expression of the meaning or significance of a wide variety of experiences, situations, data, events, judgments, conventions, beliefs, rules, procedures, or criteria.
Inference
Identifies and secures elements needed to draw reasonable conclusions; it forms conjectures and hypotheses, it considers relevant information, and it reduces or draws out the consequences flowing from data, statements, principles, evidence, judgments, beliefs, opinions, concepts, descriptions, questions, or other forms of representation.
Q8: On which group of employees do U.S.companies
Q19: The _ common law doctrine establishes temporary
Q21: These compensation systems go a long way
Q29: The Shewhart-Deming cycle plays an important role
Q90: Referring to Table 14-9, an R chart
Q99: The principal focus of the control chart
Q106: Referring to Table 14-2, what is the
Q122: Referring to Table 13-2, for these data,
Q187: Referring to Table 13-16, the 0 to
Q259: A multiple regression is called "multiple" because