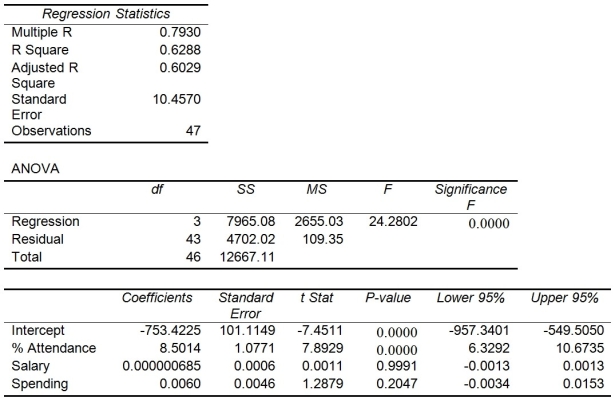
TABLE 13-15
The superintendent of a school district wanted to predict the percentage of students passing a sixth-grade proficiency test. She obtained the data on percentage of students passing the proficiency test (% Passing), daily mean of the percentage of students attending class (% Attendance), mean teacher salary in dollars (Salaries), and instructional spending per pupil in dollars (Spending) of 47 schools in the state.
Following is the multiple regression output with Y = % Passing as the dependent variable,  = : % Attendance,
  = Salaries and
  = Spending:

-Referring to Table 13-15, what are the lower and upper limits of the 95% confidence interval estimate for the effect of a one dollar increase in instructional spending per pupil on the mean percentage of students passing the proficiency test?
Definitions:
Interaction
In statistics, an occurrence when the effect of one variable depends on the level of another variable.
Main Effects
Refers to the direct impact of independent variables on dependent variables in a statistical model, without considering interactions between variables.
Total Mean
The overall average value of a dataset, calculated by summing all observations and dividing by the total number of observations.
Alternative Hypothesis
A hypothesis that proposes a statistical relationship between variables, opposite to the null hypothesis suggesting no relationship.
Q1: Which government agency provides the criteria for
Q9: Offering relevant employee benefits can lead to
Q10: Antidiscrimination laws have contributed to which of
Q11: In May 2014,the typical CEO earned approximately
Q19: Consider a regression in which b₂ =
Q29: Referring to Table 13-1, if an employee
Q44: Determining the root causes of why defects
Q63: Referring to Table 13-15, there is sufficient
Q88: Variation signaled by individual fluctuations or patterns
Q207: Referring to Table 13-5, one company in