TABLE 13-16
What are the factors that determine the acceleration time (in sec.) from 0 to 60 miles per hour of a car? Data on the following variables for 171 different vehicle models were collected:
Accel Time: Acceleration time in sec.
Cargo Vol: Cargo volume in cu. ft.
HP: Horsepower
MPG: Miles per gallon
SUV: 1 if the vehicle model is an SUV with Coupe as the base when SUV and Sedan are both 0
Sedan: 1 if the vehicle model is a sedan with Coupe as the base when SUV and Sedan are both 0
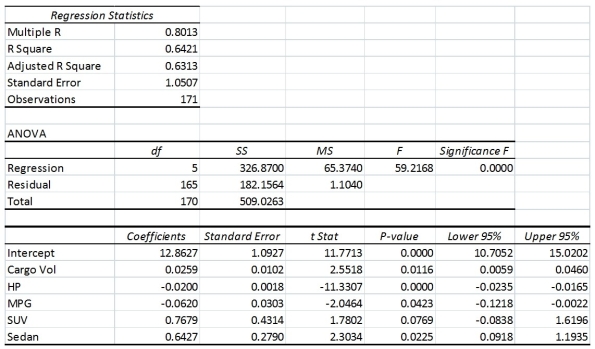
The regression results using acceleration time as the dependent variable and the remaining variables as the independent variables are presented below.
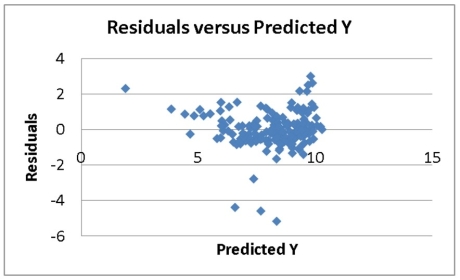
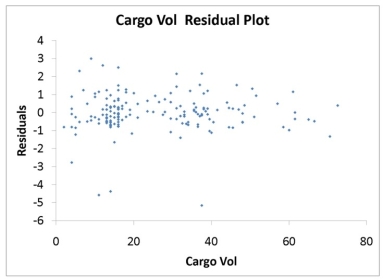
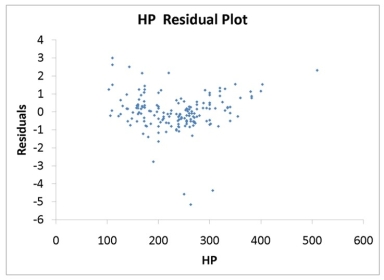
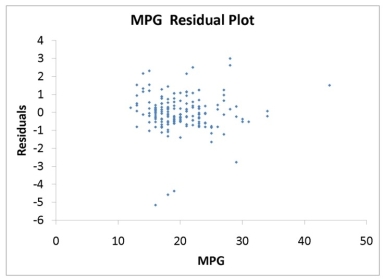
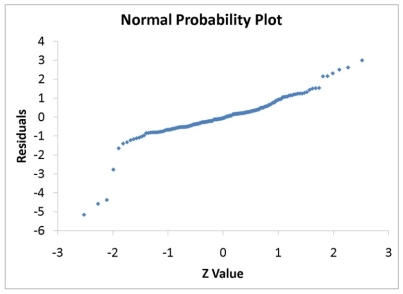
The various residual plots are as shown below.
The coefficient of multiple determination for the regression model using each of the 5 variables Xj as the dependent variable and all other X variables as independent variables (Rj2) are, respectively, 0.7461, 0.5676, 0.6764, 0.8582, 0.6632.
-Referring to Table 13-16, which of the following assumptions is most likely violated based on the residual plot for HP?
Definitions:
Process Costing
A costing method used in manufacturing, where costs are allocated to batches or processes, suitable for homogeneous products.
Weighted-Average Method
A method of inventory costing that assigns the average cost of goods available for sale to both ending inventory and cost of goods sold.
First-In, First-Out Method
An inventory valuation method where goods purchased or produced first are sold or used first, often used in the accounting of inventory costs.
Mixing Department
A section in a production facility where ingredients or components are combined to produce a final product or a mixture.
Q7: What percentage of gross earnings do Brazilian
Q19: Employment costs were highest in which two
Q21: Referring to Table 14-7, an <img src="https://d2lvgg3v3hfg70.cloudfront.net/TB2694/.jpg"
Q30: Referring to Table 11-13, if there is
Q31: Which of the following is the term
Q43: Referring to Table 14-5, the process seems
Q59: If we use the chi-square method of
Q87: Referring to Table 14-7, an R chart
Q140: Referring to Table 12-11, which of the
Q162: Referring to Table 13-1, for these data,