Examlex

Solved

TABLE 13-17 Given Below Are Results from the Regression Analysis Where the Where

question 78

Multiple Choice

TABLE 13-17
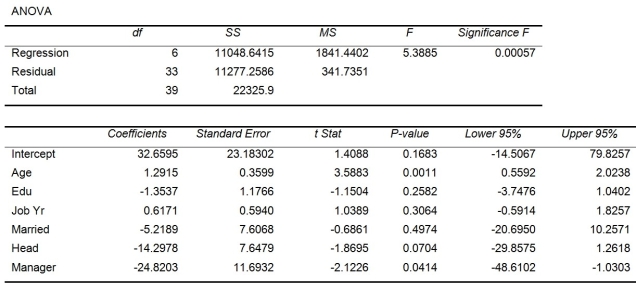
Given below are results from the regression analysis where the dependent variable is the number of weeks a worker is unemployed due to a layoff (Unemploy) and the independent variables are the age of the worker (Age) , the number of years of education received (Edu) , the number of years at the previous job (Job Yr) , a dummy variable for marital status (Married: 1 = married, 0 = otherwise) , a dummy variable for head of household (Head: 1 = yes, 0 = no) and a dummy variable for management position (Manager: 1 = yes, 0 = no) . We shall call this Model 1.
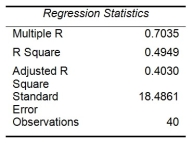
TABLE 13-17 Given below are results from the regression analysis where the dependent variable is the number of weeks a worker is unemployed due to a layoff (Unemploy)  and the independent variables are the age of the worker (Age) , the number of years of education received (Edu) , the number of years at the previous job (Job Yr) , a dummy variable for marital status (Married: 1 = married, 0 = otherwise) , a dummy variable for head of household (Head: 1 = yes, 0 = no)  and a dummy variable for management position (Manager: 1 = yes, 0 = no) . We shall call this Model 1.         Model 2 is the regression analysis where the dependent variable is Unemploy and the independent variables are Age and Manager. The results of the regression analysis are given below:        -Referring to Table 13-17 Model 1, which of the following is a correct statement? A)  49.49% of the total variation in the number of weeks a worker is unemployed due to a layoff can be explained by the age of the worker, the number of years of education received, the number of years at the previous job, marital status, whether the worker is the head of household, and whether the worker is a manager. B)  49.49% of the total variation in the number of weeks a worker is unemployed due to a layoff can be explained by the age of the worker, the number of years of education received, the number of years at the previous job, marital status, whether the worker is the head of household, and whether the worker is a manager, after adjusting for the number of predictors and sample size. C)  49.49% of the total variation in the number of weeks a worker is unemployed due to a layoff can be explained by the age of the worker, the number of years of education received, the number of years at the previous job, marital status, whether the worker is the head of household, and whether the worker is a manager, after adjusting for the level of significance D)  49.49% of the total variation in the number of weeks a worker is unemployed due to a layoff can be explained by the age of the worker, the number of years of education received, the number of years at the previous job, marital status, whether the worker is the head of household, and whether the worker is a manager, holding constant the effect of all the independent variables.
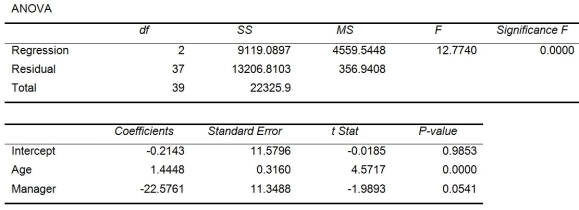
Model 2 is the regression analysis where the dependent variable is Unemploy and the independent variables are Age and Manager. The results of the regression analysis are given below:
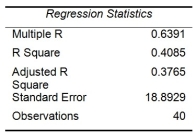
TABLE 13-17 Given below are results from the regression analysis where the dependent variable is the number of weeks a worker is unemployed due to a layoff (Unemploy)  and the independent variables are the age of the worker (Age) , the number of years of education received (Edu) , the number of years at the previous job (Job Yr) , a dummy variable for marital status (Married: 1 = married, 0 = otherwise) , a dummy variable for head of household (Head: 1 = yes, 0 = no)  and a dummy variable for management position (Manager: 1 = yes, 0 = no) . We shall call this Model 1.         Model 2 is the regression analysis where the dependent variable is Unemploy and the independent variables are Age and Manager. The results of the regression analysis are given below:        -Referring to Table 13-17 Model 1, which of the following is a correct statement? A)  49.49% of the total variation in the number of weeks a worker is unemployed due to a layoff can be explained by the age of the worker, the number of years of education received, the number of years at the previous job, marital status, whether the worker is the head of household, and whether the worker is a manager. B)  49.49% of the total variation in the number of weeks a worker is unemployed due to a layoff can be explained by the age of the worker, the number of years of education received, the number of years at the previous job, marital status, whether the worker is the head of household, and whether the worker is a manager, after adjusting for the number of predictors and sample size. C)  49.49% of the total variation in the number of weeks a worker is unemployed due to a layoff can be explained by the age of the worker, the number of years of education received, the number of years at the previous job, marital status, whether the worker is the head of household, and whether the worker is a manager, after adjusting for the level of significance D)  49.49% of the total variation in the number of weeks a worker is unemployed due to a layoff can be explained by the age of the worker, the number of years of education received, the number of years at the previous job, marital status, whether the worker is the head of household, and whether the worker is a manager, holding constant the effect of all the independent variables.
-Referring to Table 13-17 Model 1, which of the following is a correct statement?


Definitions:

Flexible Manufacturing System

A system that allows for the easy adaptation of the production equipment and processes to manufacture different types of products or change production volumes in response to market demands.

Benefits

Advantages or positive outcomes resulting from actions, activities, or participation in certain programs or initiatives.

Flexibility

Flexibility refers to the ability to adapt or adjust to new conditions, changes, or challenges without significant impact on functionality or outcomes.

Operations Managers

Professionals responsible for overseeing, designing, and controlling the process of production and redesigning business operations in the production of goods or services.

Related Questions