Examlex

Solved

TABLE 13-17 Given Below Are Results from the Regression Analysis Where the Where

question 89

True/False

TABLE 13-17
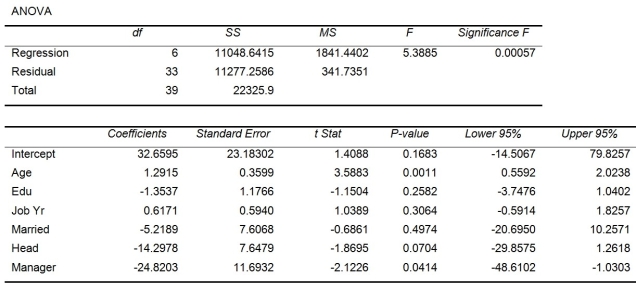
Given below are results from the regression analysis where the dependent variable is the number of weeks a worker is unemployed due to a layoff (Unemploy) and the independent variables are the age of the worker (Age), the number of years of education received (Edu), the number of years at the previous job (Job Yr), a dummy variable for marital status (Married: 1 = married, 0 = otherwise), a dummy variable for head of household (Head: 1 = yes, 0 = no) and a dummy variable for management position (Manager: 1 = yes, 0 = no). We shall call this Model 1.
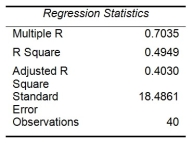
TABLE 13-17 Given below are results from the regression analysis where the dependent variable is the number of weeks a worker is unemployed due to a layoff (Unemploy) and the independent variables are the age of the worker (Age), the number of years of education received (Edu), the number of years at the previous job (Job Yr), a dummy variable for marital status (Married: 1 = married, 0 = otherwise), a dummy variable for head of household (Head: 1 = yes, 0 = no) and a dummy variable for management position (Manager: 1 = yes, 0 = no). We shall call this Model 1.         Model 2 is the regression analysis where the dependent variable is Unemploy and the independent variables are Age and Manager. The results of the regression analysis are given below:        -Referring to Table 13-17 Model 1, the null hypothesis H₀: β₁ = β₂ = β₃ = β₄ = β₅ = β₆ = 0 implies that the number of weeks a worker is unemployed due to a layoff is not related to any of the explanatory variables.
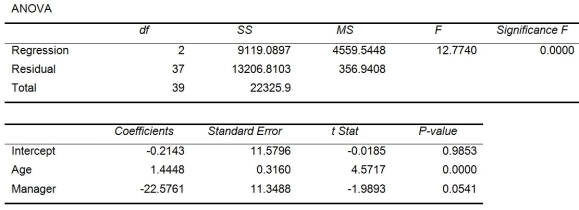
Model 2 is the regression analysis where the dependent variable is Unemploy and the independent variables are Age and Manager. The results of the regression analysis are given below:
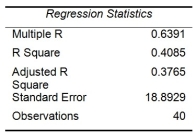
TABLE 13-17 Given below are results from the regression analysis where the dependent variable is the number of weeks a worker is unemployed due to a layoff (Unemploy) and the independent variables are the age of the worker (Age), the number of years of education received (Edu), the number of years at the previous job (Job Yr), a dummy variable for marital status (Married: 1 = married, 0 = otherwise), a dummy variable for head of household (Head: 1 = yes, 0 = no) and a dummy variable for management position (Manager: 1 = yes, 0 = no). We shall call this Model 1.         Model 2 is the regression analysis where the dependent variable is Unemploy and the independent variables are Age and Manager. The results of the regression analysis are given below:        -Referring to Table 13-17 Model 1, the null hypothesis H₀: β₁ = β₂ = β₃ = β₄ = β₅ = β₆ = 0 implies that the number of weeks a worker is unemployed due to a layoff is not related to any of the explanatory variables.
-Referring to Table 13-17 Model 1, the null hypothesis H₀: β₁ = β₂ = β₃ = β₄ = β₅ = β₆ = 0 implies that the number of weeks a worker is unemployed due to a layoff is not related to any of the explanatory variables.

Recognize different moments that influence consumers' online purchase decisions.
Differentiate between e-commerce and social commerce.
Identify elements and characteristics of social commerce strategies (such as advocacy, transparency, infectiousness, and reciprocity).
Comprehend consumer decision-making steps in the context of social commerce.

Definitions:

Corporations

Legal entities established by shareholders who invest money or assets for a common purpose and enjoy limited liability protection.

Overhead

refers to the ongoing business expenses not directly attributed to creating a product or service, including rent, utilities, and administrative costs.

Schedule Flexibility

The ability to adjust work hours or duties to accommodate different needs or preferences, often seen as a benefit in employment.

Commuting Problems

Challenges and issues faced by individuals when traveling between their place of residence and workplace, often involving time, cost, and convenience.

Related Questions