Examlex

Solved

TABLE 13-17 Given Below Are Results from the Regression Analysis Where the Where

question 225

True/False

TABLE 13-17
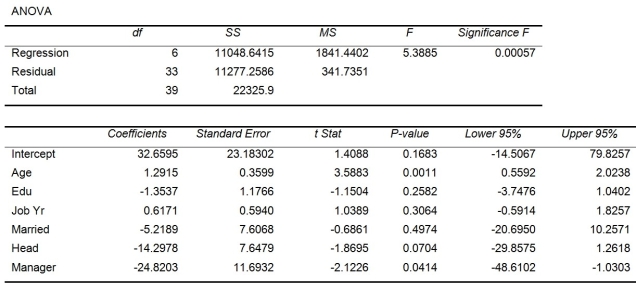
Given below are results from the regression analysis where the dependent variable is the number of weeks a worker is unemployed due to a layoff (Unemploy) and the independent variables are the age of the worker (Age), the number of years of education received (Edu), the number of years at the previous job (Job Yr), a dummy variable for marital status (Married: 1 = married, 0 = otherwise), a dummy variable for head of household (Head: 1 = yes, 0 = no) and a dummy variable for management position (Manager: 1 = yes, 0 = no). We shall call this Model 1.
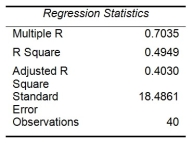
TABLE 13-17 Given below are results from the regression analysis where the dependent variable is the number of weeks a worker is unemployed due to a layoff (Unemploy) and the independent variables are the age of the worker (Age), the number of years of education received (Edu), the number of years at the previous job (Job Yr), a dummy variable for marital status (Married: 1 = married, 0 = otherwise), a dummy variable for head of household (Head: 1 = yes, 0 = no) and a dummy variable for management position (Manager: 1 = yes, 0 = no). We shall call this Model 1.         Model 2 is the regression analysis where the dependent variable is Unemploy and the independent variables are Age and Manager. The results of the regression analysis are given below:        -Referring to Table 13-17 Model 1, we can conclude that, holding constant the effect of the other independent variables, there is a difference in the mean number of weeks a worker is unemployed due to a layoff between a worker who is married and one who is not at a 1% level of significance if all we have is the information of the 95% confidence interval estimate for β₄.
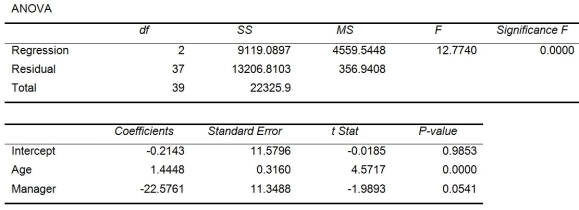
Model 2 is the regression analysis where the dependent variable is Unemploy and the independent variables are Age and Manager. The results of the regression analysis are given below:
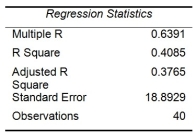
TABLE 13-17 Given below are results from the regression analysis where the dependent variable is the number of weeks a worker is unemployed due to a layoff (Unemploy) and the independent variables are the age of the worker (Age), the number of years of education received (Edu), the number of years at the previous job (Job Yr), a dummy variable for marital status (Married: 1 = married, 0 = otherwise), a dummy variable for head of household (Head: 1 = yes, 0 = no) and a dummy variable for management position (Manager: 1 = yes, 0 = no). We shall call this Model 1.         Model 2 is the regression analysis where the dependent variable is Unemploy and the independent variables are Age and Manager. The results of the regression analysis are given below:        -Referring to Table 13-17 Model 1, we can conclude that, holding constant the effect of the other independent variables, there is a difference in the mean number of weeks a worker is unemployed due to a layoff between a worker who is married and one who is not at a 1% level of significance if all we have is the information of the 95% confidence interval estimate for β₄.
-Referring to Table 13-17 Model 1, we can conclude that, holding constant the effect of the other independent variables, there is a difference in the mean number of weeks a worker is unemployed due to a layoff between a worker who is married and one who is not at a 1% level of significance if all we have is the information of the 95% confidence interval estimate for β₄.


Definitions:

Unintended Negligence

A situation where harm is caused not through deliberate action but due to a lack of attention or foresight.

Age Stratification

Social inequality between age cohorts.

Social Inequality

Disparate opportunities and rewards are allocated to various social statuses or positions within a community or society.

Age Cohorts

Groups of individuals who share similar ages and, therefore, likely experience similar societal events and cultural shifts at similar stages in life.

Related Questions